What is the average restaurant food cost percentage?
The average restaurant food cost percentage in 2025 ranges between 28% and 35% of total revenue. Quick-service restaurants often aim for 28-32%, while fine-dining establishments may hit 32-35% due to premium ingredients.
Understanding Restaurant Food Cost Percentage in 2025 - Strategies for Profitability

What Is Restaurant Food Cost?
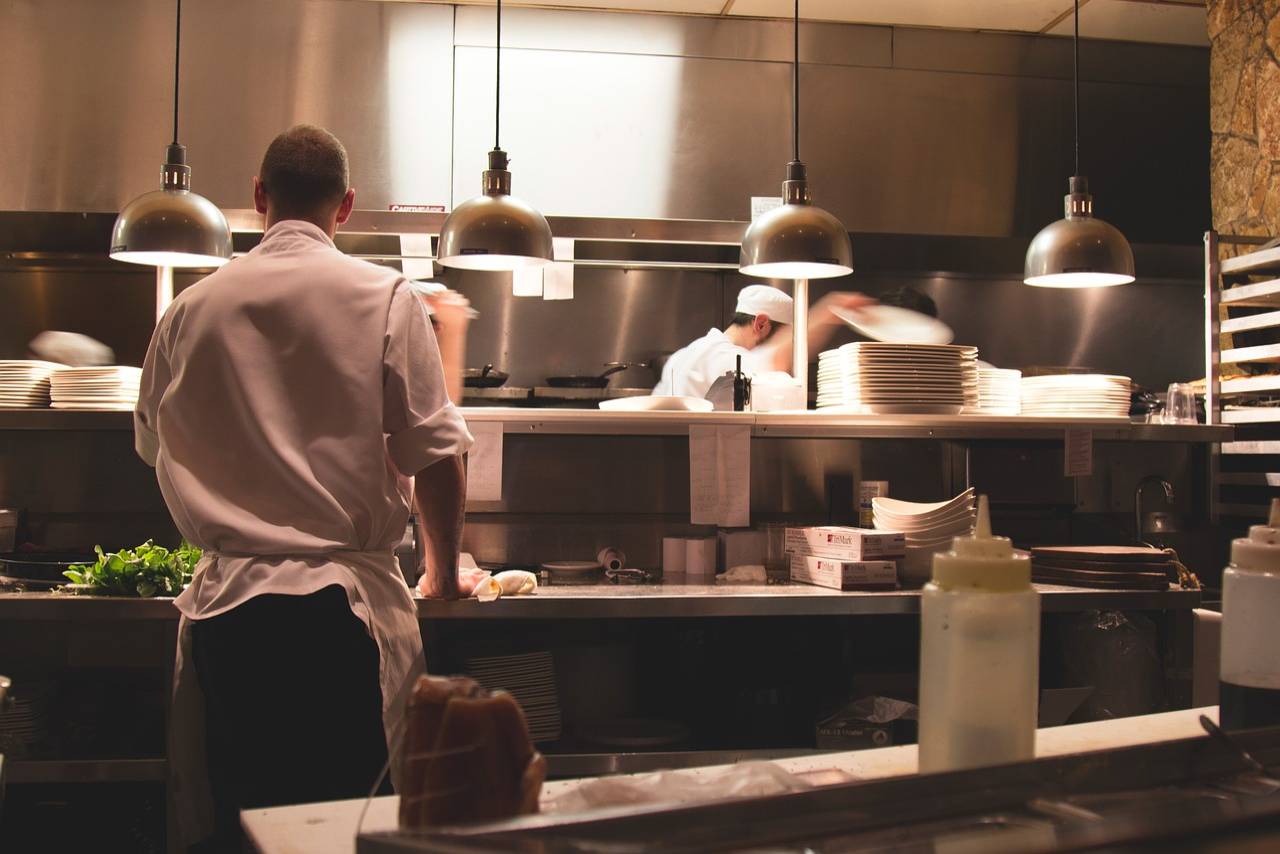
Running a successful restaurant requires balancing exceptional food quality with financial sustainability. A key factor in achieving profitability is managing food cost, the expense tied to the ingredients used in your menu items. Food cost directly affects your profit margins, making it a critical metric for any restaurant, from food trucks to upscale dining venues.
Food cost percentage is the ratio of ingredient costs to the revenue generated when those items are sold. For example, if a burger costs $3 in ingredients and sells for $10, its food cost percentage is 30%. Industry standards suggest keeping food costs between 28% and 35% of total sales to ensure profitability. When combined with labor costs (25-35%) and overhead (rent, utilities, etc.), total operating costs can reach 70-75% of revenue, leaving a tight margin for profit.
Understanding food cost empowers you to price menus effectively, reduce waste, and make data-driven decisions. This guide explores how to calculate and manage food costs to keep your restaurant thriving in 2025's competitive landscape.
Why Does Food Cost Matter?

Food cost is often the second-largest expense in a restaurant, after labor, and plays a pivotal role in financial health. Regularly calculating food cost - weekly, monthly, or per menu item - helps you monitor spending, set menu prices, and control prime costs (the sum of Cost of Goods Sold [COGS] and labor). COGS includes food, beverages, packaging, and other costs associated with preparing and serving dishes.
Tracking food cost provides three key benefits -
1. Benchmarking Against Competitors - Comparing your food cost to industry or local competitors reveals whether your spending aligns with market norms. For instance, in 2024, quick-service chains like Taco Bell maintained food costs around 30%, while casual dining restaurants averaged 32%. If your costs exceed 35%, you may need to adjust purchasing or menu strategies to stay competitive.
2. Enhancing Menu Engineering - Menu engineering involves analyzing sales and inventory data to understand each dish's popularity and profitability. For example, a high-cost steak might be popular but yield low margins, while a pasta dish could be both low-cost and high-margin. By studying these patterns, you can promote profitable items or reengineer underperformers to boost revenue.
3. Identifying Unprofitable Menu Items - High ingredient costs or oversized portions can erode profits. Tracking food cost per dish helps you spot items that cost more than they earn. For instance, if avocados surged 10% in 2024 due to supply issues, guacamole might become unprofitable unless you adjust its price or portion.
By mastering food cost analysis, you ensure customers receive value without overpaying, while your restaurant maintains healthy margins.
How to Calculate Food Cost Percentage
Calculating food cost percentage is a simple yet powerful tool for managing expenses. The formula uses inventory and sales data to determine how much of your revenue goes toward ingredients.
Formula -
Food Cost Percentage = [(Beginning Inventory + Purchases - Ending Inventory) / Total Food Sales] x 100
Step-by-Step Example
Imagine you run a casual dining restaurant. For one week -
1. Beginning Inventory - $12,000 (value of ingredients at week's start)
2. Purchases - $6,000 (new ingredients bought during the week)
3. Ending Inventory - $10,000 (value of ingredients left at week's end)
4. Total Food Sales - $22,000 (revenue from menu items sold)
Calculate food cost
Food Cost = ($12,000 / $6,000 - $10,000) = $8,000
Calculate percentage
Food Cost Percentage = ($8,000 / $22,000) x 100 = 36.36%
This result (36.36%) is slightly above the ideal 2835% range, signaling a need to investigate high-cost
items, waste, or portion sizes. Tracking this metric daily, weekly, or monthly helps you identify trends and act swiftly.
Pro Tip - Use a point-of-sale (POS) system with inventory tracking to automate calculations, reducing errors and saving time.
What Is the Average Restaurant Food Cost in the U.S. in 2025?
In 2025, the average restaurant food cost percentage typically falls between 28% and 35%, varying by restaurant type and market conditions -
1. Quick-Service Restaurants (QSRs) - 28-32% (e.g., Wendy's reported ~30% in 2024).
2. Casual Dining - 30-34% (e.g., Olive Garden averaged ~33%).
3. Fine Dining - 32-35%, driven by premium ingredients like organic produce or imported seafood.
These ranges reflect 20242025 trends, including -
1. Ingredient Price Volatility - Food inflation slowed to 2-4% in 2025, but proteins (beef, poultry) and specialty items (avocados, almonds) remain 5-8% higher than 2023 levels due to supply chain constraints.
2. Sustainability Demands - Consumer preference for local, organic ingredients increased costs for 60% of restaurants in 2024 surveys.
3. Labor Impacts - Rising minimum wages (e.g., $16-$20/hour in many U.S. states) push operators to offset costs by tightening food cost controls.
If your food cost exceeds 35%, consider reviewing supplier contracts, portion sizes, or menu composition to align with industry benchmarks.
Who Needs to Know the Average Restaurant Food Cost?
Food cost percentage is essential for anyone involved in restaurant operations, including owners, managers, chefs, and accountants. It informs critical decisions like -
1. Menu Pricing - Ensures prices cover ingredient costs while remaining competitive. For example, a $15 salad with $4.50 in ingredients yields a 30% food cost, ideal for casual dining.
2. Portion Control - Balances customer satisfaction with profitability. Oversized portions can push costs above 35%.
3. Cost Management - Helps navigate ingredient price spikes, like the 12% rise in dairy costs in 2024.
4. Profit Optimization - Encourages pairing high-cost items (e.g., lobster) with low-cost ones (e.g., rice) to achieve a target average.
For instance, if your food cost is 38% and profits are slim, you might introduce a low-cost, high-margin dessert to offset pricier entrees. Regular analysis of food cost data equips you to adapt to market challenges and maintain profitability.
Transform Your Restaurant Operations Now!
Effortless Inventory Tracking with Altametrics!
Is the Average Restaurant Food Cost Different Globally?
While dining prices vary by country due to local economies and consumer habits, restaurant food cost percentages are relatively consistent globally, ranging from 25-35% of a meal's menu price. Examples include -
1. Asia - QSRs like KFC in China target 28-30%, while fine-dining venues in Japan hit 32-35%.
2. Europe - Full-service restaurants in France or Italy aim for 30-33%, factoring in high labor and tax costs.
3. Australia - Casual dining venues maintain 29-32%, despite elevated import costs for non-local ingredients.
Global similarities stem from shared challenges- supply chain disruptions, labor shortages, and fluctuating commodity prices. For example, global wheat prices rose 6% in 2024 due to weather impacts, affecting bakeries and pizzerias worldwide. Effective inventory management and menu planning are universal strategies to keep costs in check.
Strategies to Control Food Costs
To maintain food costs within 28-35%, adopt these proven strategies
Track Inventory Daily
Conduct regular inventory counts to monitor usage and minimize waste from spoilage or over-purchasing. For example, overstocking perishable items like lettuce can inflate costs by 2-3%.
Master Menu Engineering
Categorize menu items by profitability and popularity (e.g., stars = high-profit, high-sales; dogs = low-profit, low-sales). Promote stars and reengineer or remove dogs to optimize margins.
Use a POS System
A POS with inventory integration generates product mix reports, showing which items sell well and which drag down profits. This data guides pricing and promotion decisions.
Monitor Ingredient Prices
Stay informed about market trends (e.g., 2025's projected 5% rise in seafood costs) and negotiate with suppliers or switch to cost-effective alternatives when prices spike.
Apply Menu Psychology
Design menus to highlight high-margin items using visual cues (e.g., boxes, bold text) or strategic placement (top-right corner). This can increase sales of profitable dishes by 10-15%.
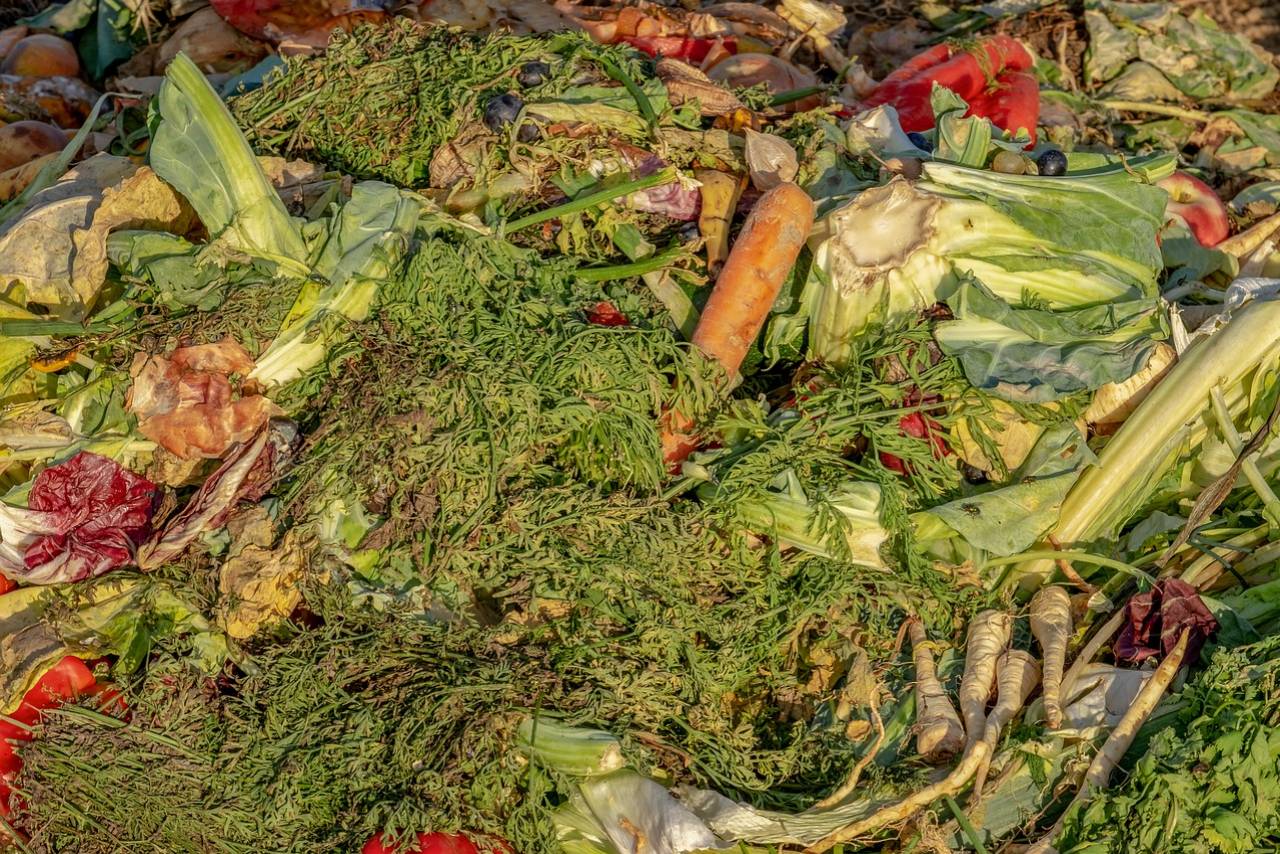
Reduce Waste
Train staff on proper portioning and repurpose leftovers (e.g., vegetable scraps for stocks). Restaurants reducing waste by 5% can lower food costs by 1-2%.
Track Inventory Daily
Conduct regular inventory counts to monitor usage and minimize waste from spoilage or over-purchasing. For example, overstocking perishable items like lettuce can inflate costs by 2-3%.
Master Menu Engineering
Categorize menu items by profitability and popularity (e.g., stars = high-profit, high-sales; dogs = low-profit, low-sales). Promote stars and reengineer or remove dogs to optimize margins.
Use a POS System
A POS with inventory integration generates product mix reports, showing which items sell well and which drag down profits. This data guides pricing and promotion decisions.
Monitor Ingredient Prices
Stay informed about market trends (e.g., 2025's projected 5% rise in seafood costs) and negotiate with suppliers or switch to cost-effective alternatives when prices spike.
Apply Menu Psychology
Design menus to highlight high-margin items using visual cues (e.g., boxes, bold text) or strategic placement (top-right corner). This can increase sales of profitable dishes by 10-15%.
Reduce Waste
Train staff on proper portioning and repurpose leftovers (e.g., vegetable scraps for stocks). Restaurants reducing waste by 5% can lower food costs by 1-2%.
Summary
In 2025, managing restaurant food costs is essential for profitability amid rising ingredient prices, labor challenges, and consumer expectations. By keeping food costs between 28% and 35%, you can price menus competitively, minimize waste, and maximize margins. Regular tracking, menu engineering, and strategic pricing are key to success.
Ready to streamline your food cost management? Explore Altametrics' powerful tools for inventory tracking, POS integration, and menu engineering. Visit Altametrics.com to schedule a free demo and elevate your restaurant's profitability today.
Ready to streamline your food cost management? Explore Altametrics' powerful tools for inventory tracking, POS integration, and menu engineering. Visit Altametrics.com to schedule a free demo and elevate your restaurant's profitability today.
Recommended
restaurant management
Find the Best Restaurant Chemical Suppliers
restaurant management
How to Find the Best Restaurant Coffee Suppliers
restaurant management
The Best Restaurant Produce Suppliers in America
restaurant management
8 Tips for Successful Financial Management In Food Service
restaurant management
Ordering Management System- Issues Faced by Multi-Chain Restaurants In 2022
restaurant management
5 Questions to Ask Yourself Before Hiring a Food Service Management Company

restaurant management
What Are The Best Restaurant Paper Goods Suppliers?
restaurant management
How Restaurant Food Suppliers Are Important To A Business
restaurant management
Food Waste Management Solutions- The Ultimate Guide to Eliminating Food Waste

restaurant management
3 Tips to Find the Best Restaurant Paper Suppliers
restaurant management
5 Tips for Choosing the Best Kitchen Equipment Supplier
restaurant management
Food Waste Management- 6 Strategies to Reduce the Impact of Food Waste

restaurant management
Issues Facing Multi-Chain Restaurants In 2022

restaurant management
The Best Food Service Management Companies in the Industry

restaurant management
How to manage your restaurant inventory planning to ensure you're never caught short

restaurant management
3 top reasons your managers should always earn their bonuses

restaurant management
How to Effectively Reduce Expenses and Increase Staff Engagement in Your Restaurant
restaurant management
How to Transform Your Restaurant Operations
restaurant management
5 Ways Restaurants Can Leverage Automation for Operational Success
restaurant management
California's Updated Overtime and Break Laws for Restaurants
restaurant management
How Technology Can Improve Employee Management in Restaurants

restaurant management
The Best Employee Rewards Programs for Restaurants
restaurant management
How to Reduce Labor Costs in Your Restaurant Without Sacrificing Service

restaurant management
How to Efficiently Calculate and Manage Labor Cost in Restaurants
restaurant management
Understanding Restaurant Food Cost Percentage in 2025 - Strategies for Profitability

restaurant management
5 Practical Strategies to Cut Food Waste in Your Restaurant

restaurant management
How to Create Custom Recipe Templates for Your Restaurant Kitchen

restaurant management
Top 10 California Employment Laws Every Restaurant Owner Must Know

restaurant management
How to Use Customer Data to Personalize the Dining Experience and Build Loyalty
Frequently Asked Questions
What is a good food cost percentage for restaurants?
Aim for 2835% of revenue. Quick-service restaurants target 28-32%, while fine dining may reach 32-35%.
How can I lower food costs without sacrificing quality?
Optimize portions, promote high-margin items, and track inventory to reduce waste while maintaining customer satisfaction.
What tools help track food costs?
POS systems with inventory features, spreadsheets, or dedicated software provide accurate, real-time cost data.
How often should I calculate food costs?
Weekly or per-menu-item calculations offer the best insights. Daily checks on high-cost ingredients can further refine control.